Gandhara Industries Limited Report for Fiscal Year 2023
This report offers a detailed snapshot of the macroeconomic conditions, industry and company highlights of Gandhara Industries Limited (GHNI).
Disclaimer: The article below is the work of a participant of Fundamentals of Capital Market training. Sarmaaya.pk holds no liability for the recommendation mentioned.
This report includes a detailed analysis of Gandhara Industries Limited (GHNI). It is one of the leading companies in the Automobile Assembly sectorAutomobile Assembly sector of Pakistan Stock Exchange (PSX). The report also includes Pakistan's country profile, company’s business overview, and a detailed financial, business, and management analysis. Through a thorough examination of these factors, the aim of this report is to provide investors with a holistic understanding of the company's market position and investment worthiness.
In a Nutshell
Analyst Background:
This report was conducted by Farhan Aslam, a participant in the Fundamentals of Capital Market (Batch 6), by Ammar Yaseen. Farhan is a Distinguished Principal Solution Consultant for NetSuite’s AMO Solution Consultant team. He is a Financial Technology professional, a Certified Management Accountant, and received his Master of Science in Information Systems from Minot State University, Minot, ND. Throughout his career, he has gained immense expertise in the field of Cloud-Based ERP Systems due to his deep insight into not only current and emerging technologies but also his unique ability to understand complex accounting problems of enterprise-level companies due to his accounting designation.
Macroeconomic Profile:
In FY2023, Pakistan's economic landscape faced the challenges of increasing interest rates, surging inflation and a depreciating rupee. The period brought about formidable hurdles, including heightened import prices for raw materials, political uncertainty, and lately escalating oil prices and load shedding due to climate change and pollution. Despite these obstacles, the company accomplished a remarkable feat, witnessing a substantial 62% increase in unit sales. This achievement not only mirrored the overall positive momentum in the industry in Pakistan but also underscored resilience in maintaining a 47% market share despite the prevailing adverse economic conditions.
Company Profile:
Ghandhara Industries Limited (GHNI) serves as the exclusive distributor of ISUZU products in Pakistan and is affiliated with the Bibojee Group of Companies. At GIL, they take immense pride in their performance within one of the world's most competitive truck markets, excelling in terms of loading capacity and fuel efficiency through cutting-edge engineering and manufacturing technologies. GIL has earned a reputation for delivering reliable, comfortable, and cost-efficient Trucks, Buses, and Pickups.
With over 55 years of history in Pakistan, GIL stands as one of the leading automobile companies. Their product range spans from pickups to heavy-duty trucks and buses. The ISUZU truck, a flagship product, consistently leads the way with superior specifications and reliability. Customers rely on the outstanding performance and superb fuel economy of our trucks, especially in challenging operating conditions. GIL and ISUZU share a commitment to environmental responsibility, integrating superior engineering capabilities to ensure compliance with the most stringent emissions regulations.
Financial Analysis:
Growth Factors:
Revenue CAGR:
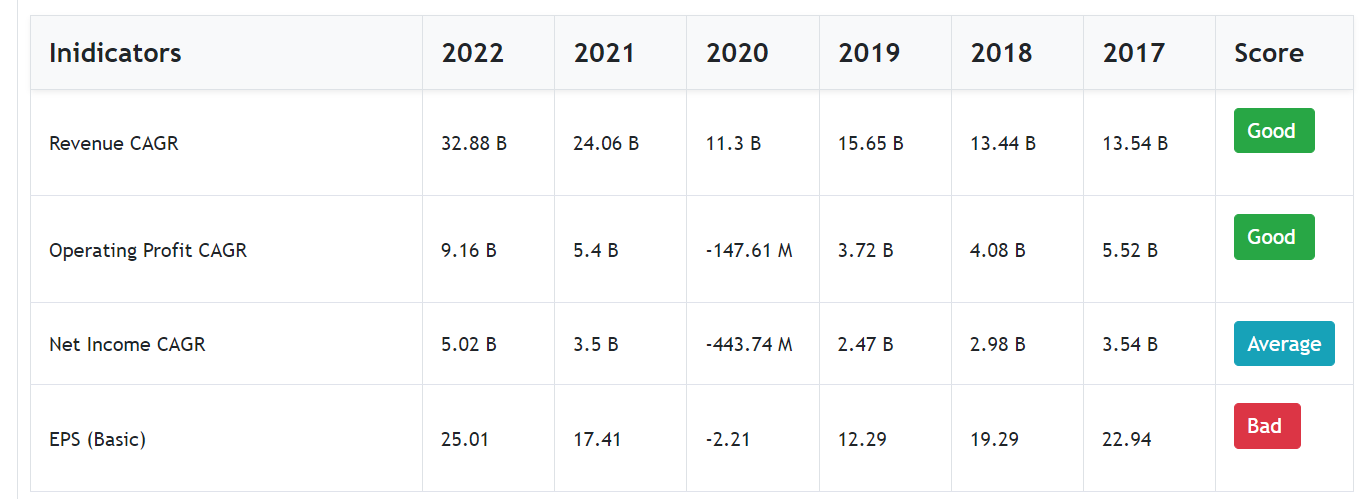
Ghandhara Industries Limited, concluding FY2023, demonstrated a shift in revenue, recording sales of approximately Rs. 14.47 billion compared to Rs. 24.27 billion in 2022. This results in a noteworthy negative Compound Annual Growth Rate (CAGR) of approximately -14.1%, indicating a decline in the company's top-line performance over the past year.
The operating profits have undergone a substantial adjustment, reflective of the company's efforts to adapt to changing market conditions. Additionally, the net income has experienced a significant contraction, prompting a closer examination of the company's financial performance and profitability.
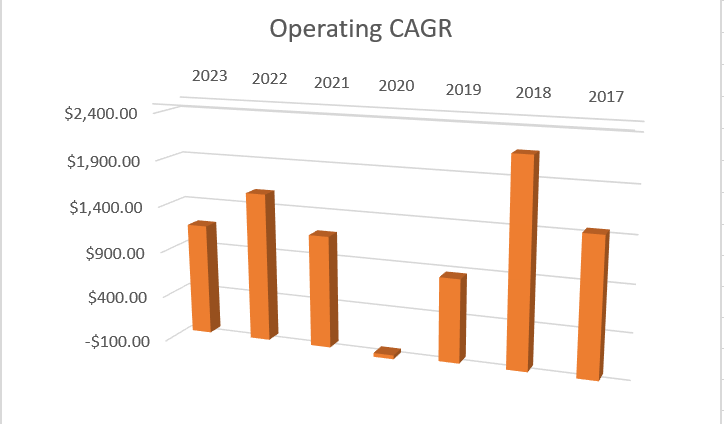
Operating Profit CAGR:
The Operating Profit CAGR showed moderate growth, reaching 1.19 billion (15.82 %) in 2023 compared to 1.59 billion(12.19%) in 2022. While positive, it is important to note that the growth rate was relatively lower than revenue, suggesting potential challenges in maintaining profitability or increased operational costs.
Net Income CAGR:
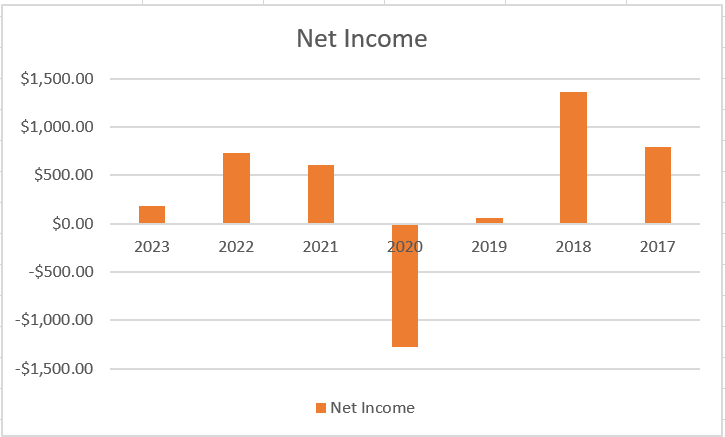
Ghandhara Industries Limited has experienced fluctuations in its net income over the past several years. In 2023, the net profit stood at Rs. 179.42 million which is a meagre (1.32%), reflecting a relatively modest decline compared to a 3% net profit growth over figures of the previous year. Overall, in 2023 although the sales per unit increased, there was an overall reduction of revenue. The year 2022 demonstrated a significant increase in net income, reaching Rs. 728.5 million, showcasing a positive trend.
However, in 2021, there was a decline in net income to Rs. 604.21 million, suggesting challenges or adjustments in the company's operational performance. The most notable change occurred in 2020, where the net income turned into a significant loss of approximately Rs. 1.28 billion, indicating a challenging financial period for the company.
The subsequent years saw a recovery, with 2019 showing a net income profit of Rs. 59.95 million, and 2018 witnessing a substantial increase to Rs. 1.36 billion. In 2017, the net income profit stood at Rs. 796.01 million, reflecting a positive performance.
Overall, Ghandhara Industries Limited's operating profit has demonstrated variability, with recovery and growth observed in certain years. The recent fluctuations in FY 2023 can be attributed to challenges in rising costs of importing raw materials due to expensive foreign exchange, market conditions, high interest rates & external factors influencing the company's operational dynamics.
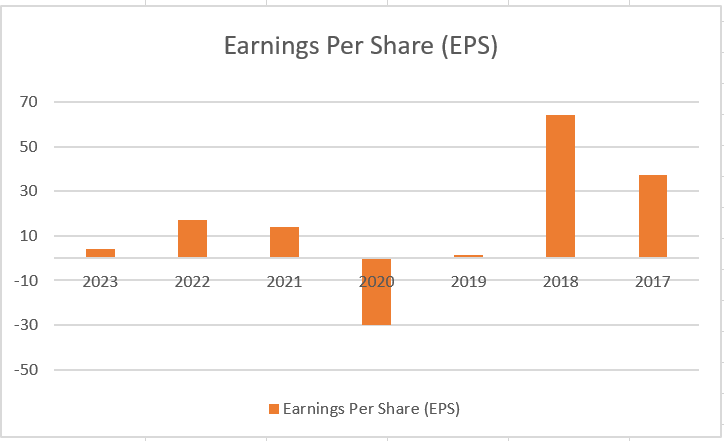
Earnings Per Share (EPS):
Ghandhara Industries Limited's Earnings Per Share (EPS) has exhibited diverse trends in recent years. The EPS growth factors showcase the company's financial performance dynamics alongside operating profit figures.
In 2023, with an net income profit of Rs. 179.42 million, the EPS growth factor stood at 4.21, indicating a moderate expansion in earnings. The previous year, 2022, demonstrated substantial growth in both net income profit (Rs. 728.5 million) and EPS growth factor (17.10), signaling positive momentum.
Despite a decline in net income profit in 2021 (Rs. 604.21 million), the EPS growth factor remained positive at 14.18, reflecting the company's ability to manage earnings amid operational challenges. The challenging year of 2020, marked by a significant loss in operating profit (approximately -Rs. 1.28 billion), resulted in a negative EPS growth factor of -30.11.
The subsequent years, 2019, 2018, and 2017, witnessed varying levels of positive growth in both operating profit and EPS growth factors, indicating periods of robust financial performance.
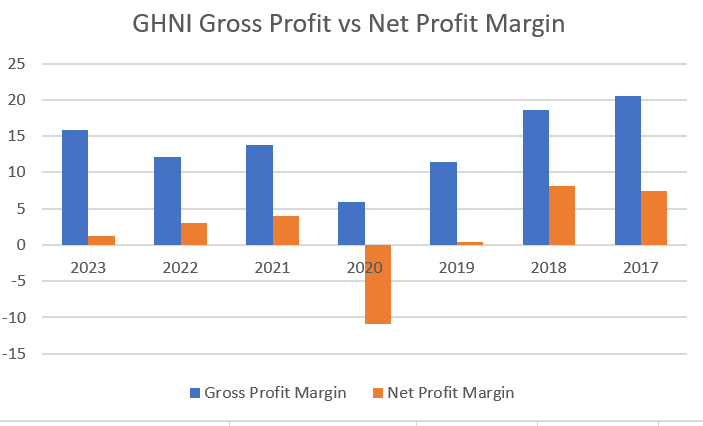
Stability Factors:
Ghandhara Industries Limited's financial stability is characterized by fluctuations in key metrics over the past years. The operating margin percentage experienced a substantial decrease in 2020, signaling challenges in generating profits from core operations. However, a positive rebound in 2021,2022 & 2023 suggests resilience, though an overall trend of volatility persists.
Similarly, the net margin percentage displayed significant fluctuations, particularly in 2020. Although the company managed to recover in 2022 and 2023, an increase in finance costs led to a decrease in profitability in 2023. On a whole, a negative trend in 2020 indicates vulnerability to external factors impacting profitability, necessitating continuous monitoring.
The corporate tax rate notably increased in 2022, potentially impacting overall net income, although that has decreased to a more modest level in 2023. A consistent or increasing tax rate may pose challenges to maintaining stable profitability, prompting investors to closely watch for its impact on the company's bottom line.
The interest coverage ratio has generally been positive, indicating the company's ability to meet interest obligations. However, a negative value in 2020 raises concerns about the company's capacity to cover interest expenses during that period, requiring continuous monitoring for financial stability.
Total debt increased over the years, and the debt-to-equity ratio rose, signaling a higher reliance on debt for financing. While moderate leverage is common, careful monitoring is necessary to prevent excessive financial risk, prompting investors to pay attention to the company's debt management strategies.
The current ratio has remained relatively stable, suggesting the company's ability to cover short-term obligations with its current assets. A consistent current ratio is a positive indicator of liquidity and financial stability, providing a buffer against short-term financial challenges.
Negative cash flow from operations and net change in cash, especially in 2022, raise concerns about the company's ability to generate sufficient cash internally and manage liquidity effectively Although in the more recent 2023 quarters this trend has been reversed, several years of cashflow negative legacy remains.
Return on Equity (ROE) percentage has shown fluctuations, with a significant decrease in 2020. Investors typically seek consistent and positive ROE, and the negative trend in 2020 may raise questions about the company's efficiency in utilizing equity, prompting consideration of strategies to improve ROE.
Net Fixed Assets Turnover (NFAT) displayed a varying trend but has generally remained positive. A consistent or increasing NFAT indicates effective utilization of fixed assets, contributing to overall operational efficiency. Continuous monitoring of NFAT is essential for assessing operational effectiveness.
With Ghandhara Industries, certain stability factors such as the current ratio and interest coverage, demonstrate resilience, Ghandhara does faces challenges in maintaining consistent profitability, managing debt, and generating positive cash flows. Ongoing monitoring and strategic interventions will be essential for ensuring long-term stability and investor confidence.
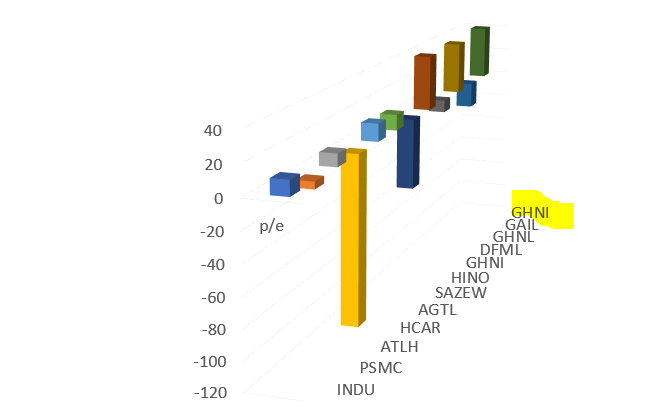
Valuation Factors:
Ghandhara Industries Limited's valuation metrics present a diverse landscape, offering insights into various aspects of the company's financial standing. The Price-to-Earnings (PE) ratio exhibited variations over the years, standing at 9.24 in 2022. This suggests potential undervaluation or a conservative market sentiment. The Earnings Yield in 2022 was 0.11%, providing an optimistic outlook for investors. The absence of PEG ratio values raises attention, requiring further analysis to assess the company's growth prospects.
The Price-to-Book (PB) ratio in 2022 is 1.05, suggesting potential undervaluation. The Price-to-Sales (PS) ratio in 2022 is 0.28, implying a favorable valuation based on sales performance. The Graham Value in 2022 is 9.73, indicating potential undervaluation, requiring thorough analysis.
Ghandhara Industries Limited has not provided dividends in recent years, with a 0.00% dividend yield. Investors seeking dividends may find this less attractive. The Enterprise Value-to-EBITDA (EV-to-EBITDA) ratio in 2022 is 9.97, relatively moderate compared to industry benchmarks.
Fig. Industry Price-to-Earnings for Ghandhara and Leading Peers in Manufacturing
From a Birds Eye view, Ghandhara Industries exhibits mixed signals in its valuation factors. While certain metrics suggest potential undervaluation, such as the PE ratio and Graham Value, others, like the absence of PEG ratio and the non-existence of dividend yield, warrant careful consideration.
Ghandhara Industries Limited's stock valuation has been diligently assessed through various methods, providing a comprehensive perspective on its intrinsic value. The Discounted Cash Flows (DCF) analysis for Earnings Per Share (EPS) yields a valuation of 408.24, incorporating a substantial margin of safety at 71.04%, indicative of a conservative evaluation and suggesting potential undervaluation. The DCF cash valuation stands at a robust 3413.35, accompanied by an impressive margin of safety of 96.4%, reinforcing the notion that the stock may be undervalued with a significant buffer against uncertainties. Additionally, the Peter Lynch value for Ghandhara is estimated at 236.4, emphasizing potential undervaluation with a substantial margin of safety at 92.77%. All values indicate a good and favorable valuation from a stock perspective.
Business and Management Analysis:
Business Factors:
Sales and Production Capacity:
The decrease in sales revenue from Rs. 24.27 billion in 2022 to Rs. 14.54 billion in 2023 aligns with the noted declining trend in the overall truck and bus market. This decline may be attributed to various market challenges and economic conditions affecting the industry and the country in general.
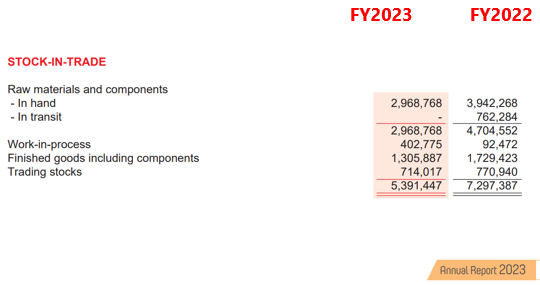
The production and inventory figures indicate a proactive approach in managing the production capacity, with increased raw materials and work-in-process inventory. However, the decrease in trading stocks suggests a strategic shift in response to the decreasing sales trend from FY2022 TO FY2023
Despite the challenging market conditions, the company has sustained its 1st position in market share at 42%, showcasing resilience and effective market positioning.
Profit Conversion:
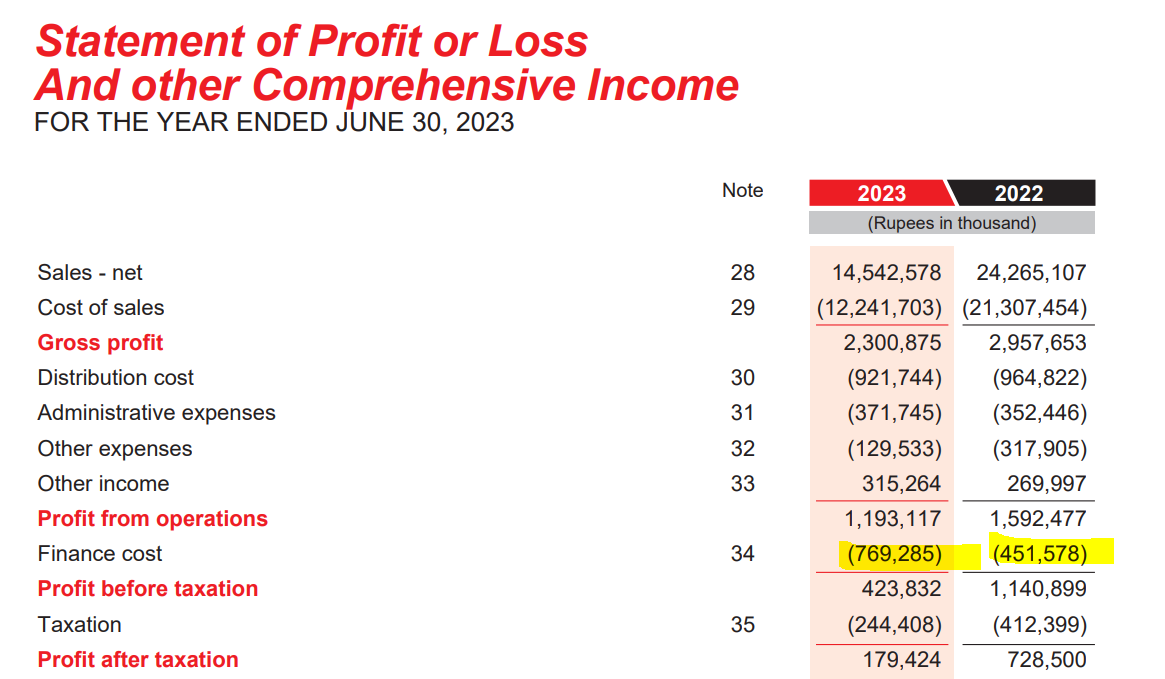
The Profit from Operations decreased from Rs. 1,592,477 in 2022 to Rs. 1,193,117 in 2023. This decline is in line with the decreased sales revenue, suggesting a direct correlation between sales performance and operational profitability.
Finance costs increased significantly from Rs. 451,578 in 2022 to Rs. 769,285 in 2023. The higher finance costs may be associated with increased borrowings or interest rates, impacting overall profitability.
Profit before tax decreased from Rs. 1,140,899 in 2022 to Rs. 423,832 in 2023. The substantial drop is mainly driven by the decline in sales and an increase in finance costs, indicating challenges in maintaining previous levels of operational profitability.
Taxation expenses decreased from Rs. 412,399 in 2022 to Rs. 244,408 in 2023. The lower taxation may provide a partial buffer to the overall profit decline, but it's not sufficient to offset the broader challenges faced by the business.
Profit after tax decreased from Rs. 728,500 in 2022 to Rs. 179,424 in 2023. This significant decrease underscores the impact of the challenging market conditions on the bottom line.
The business is currently facing considerable challenges, evident in the declining sales trend and Net Profit Margins although the Operating Profit remains in the positive overall the profitability is taking a nosedive. The current cumulative Profit after Taxation (cPAT) at 2.8 Billion is higher than the cumulative cash flow from operations (cCFO) at -1.42 Billion signalling issues with cashflows and possibly a cash crunch in the future. While the company has strategically managed its production capacity and maintained market share, the decreased profit conversion for 2023 reflects the broader industry challenges and economic uncertainties around foreign exchange, political instability, import controls for raw materials, foreign exchange challenges in general and fuel prices.
Profitability was particularly affected by a substantial decrease in sales revenue, an increase in finance costs, and the overall economic landscape. Strategic adjustments in inventory management, production capacity, and market positioning suggest an adaptive response to the prevailing market conditions.
The company's focus on an unmatched and affordable product lineup with reliable after-sales service, as highlighted in the sales context, will be crucial for navigating through these challenges and regaining profitability. Continuous monitoring, flexibility in strategies, and a keen eye on market dynamics will be essential for the business to adapt and thrive in the evolving economic environment.
Management Factors:
As of June 30, 2023, Ghandhara Industries Limited boasts a diverse ownership structure with 7,925 shareholders collectively holding 42,608,844 shares. The distribution spans various categories, starting with a majority of individual shareholders, particularly those holding between 1 to 5000 shares. Directors, CEOs, and related parties maintain a minimal share percentage, emphasizing a dispersed ownership structure among key company figures.
A notable feature is the concentrated ownership among associated entities, including Ghandhara Automobiles Limited and Bibojee Services (Pvt) Limited, collectively holding a significant 58.87% of the company's shares. This concentration signifies robust inter-company ties and strategic alliances. Additionally, institutional investors, such as Investment Corporation of Pakistan, CDC - Trustee National Investment (Unit) Trust, banks, and development financial institutions, contribute to a diversified ownership structure. Insurance companies, modarabas, and mutual funds also play a role, collectively holding a modest share percentage. Local and foreign general public shareholders account for approximately 24.55%, indicating widespread distribution among individual and retail investors.
Key observations include the concentration of ownership among associated companies, suggesting a unified business approach, and moderate institutional participation. Foreign shareholders contribute marginally to the overall international ownership diversification. However, details regarding the company's dividend policy remain undisclosed, requiring additional sources or communication with the company for a comprehensive understanding. The shareholding pattern underscores a mix of individual, institutional, and associated company ownership, offering a diversified and dynamic landscape. Further insights into the company's dividend policy and mutual fund holdings would enhance the overall understanding of its financial dynamics.
Strength and Weakness
Strengths:
- 1. Resilience in Market Share:
Despite the challenging economic landscape in FY2023, the company showcased resilience by maintaining a 47% market share. This indicates a strong market position, effective strategic planning, and the ability to withstand adverse conditions better than competitors.
- 2. Sales Growth Amid Economic Challenges:
Achieving a remarkable 62% increase in unit sales during a period of economic challenges demonstrates the company's agility and market adaptability. The positive momentum in unit sales reflects consumer trust and satisfaction with the product lineup.
- 3. Strategic Affiliation and Product Reputation:
Ghandhara Industries Limited, as the exclusive distributor of ISUZU products in Pakistan and part of the Bibojee Group of Companies, benefits from strategic affiliations and a reputable product lineup. The company's focus on leading-edge engineering and manufacturing technologies positions it as a key player in Pakistan's competitive truck market.
- 4. Vulnerability to Economic Sensitivity:
The company's financial performance is sensitive to external economic factors, as evidenced by the impact of interest rate increases and inflation. A high sensitivity to economic conditions may pose challenges during periods of economic uncertainty.
- 5. Cash Flow Constraints:
Negative cash flow from operations and net change in cash, particularly in 2022, raises concerns about the company's liquidity. Adequate cash flow management is essential for sustaining operations and meeting financial obligations.
- 6. Limited Dividend Information:
The absence of explicit information on dividend distribution in recent years may affect the company's appeal to income-focused investors. Clarity on the dividend policy and future dividend prospects would provide a more comprehensive understanding of shareholder returns.
Weaknesses:
- 1. Profitability Challenges and Economic Sensitivity:
The company faced a decline in profit, evident in the decrease in profit after tax from Rs. 728.5 million in 2022 to Rs. 179,424 in 2023. Economic challenges, including interest rate increases and inflation, impacted the company's bottom line, highlighting sensitivity to external economic factors.
- 2. Financial Leverage and Debt Increase:
The rising trend in total debt and debt-to-equity ratio indicates an increasing reliance on debt for financing. While moderate leverage is common, continuous monitoring is crucial to prevent excessive financial risk. High levels of debt could lead to increased interest costs and financial instability.
- 3. Cash Flow Constraints:
Negative cash flow from operations and net change in cash, especially in 2022, raises concerns about the company's liquidity. Managing cash flow effectively is essential for ongoing operations, investment, and debt service. Cash flow constraints can impact the company's ability to seize growth opportunities and meet financial obligations.
- 4. Vulnerability to Economic Sensitivity:
The company's financial performance is sensitive to external economic factors, as evidenced by the impact of interest rate increases and inflation. A high sensitivity to economic conditions may pose challenges during periods of economic uncertainty.
- 5. Limited Dividend Information:
The absence of explicit information on dividend distribution in recent years may affect the company's appeal to income-focused investors. Clarity on the dividend policy and future dividend prospects would provide a more comprehensive understanding of shareholder returns.
Summary
Given the complexities and challenges outlined in Ghandhara Industries' financial and operational landscape, investors should approach the decision to buy the company's stock with caution. While the company has demonstrated resilience in maintaining market share and adapting to economic challenges, the declining trend in financial metrics particularly operating and net profitability, increasing vulnerability to economic sensitivity, and concerns about cash flow management necessitate a thorough and ongoing evaluation.
The stability factors, such as fluctuations in operating and net margins, increased debt levels, and a rising debt-to-equity ratio, pose risks to the company's financial health. The negative cash flow in 2022 and ongoing concerns about cash flow management and liquidity are red flags that should not be ignored. Although the current ratio has remained relatively stable, the negative cash flow from operations and net change in cash indicate potential challenges in meeting short-term financial obligations.
The DCF analysis provides a favorable valuation perspective, but it's essential to consider the broader economic context and industry dynamics.
Investors are advised to closely monitor the company's response to the identified challenges, management's strategies for adapting to market conditions, and the execution of any initiatives aimed at improving profitability and financial stability. At this time based on these factors, my recommendation would be to NOT buy the stock.